Tags: geography, chatgpt, stats 31st Mar 2023
Quizzing ChatGPT on geographical knowledge
Full honesty: this post began out of a little investigation into some inconsequential capabilities of ChatGPT, however it remains complete, and I’m not too happy with my methods, but the hours I’ve sunk into this has grown too much to forget it, but it remains too much effort to conclude properly and is no longer interesting.
Summary: In this post I investigated ChatGPT’s ability to recall the coordinates of a city, using a script to test it on about 800 cities using the OpenAI API. Against my expectations, I find no evidence to support my suspicion of a correlation between ChatGPT’s coordinate recall accuracy and properties like population, tourism or some sense of prominence. I mess around investigating other things, but find nothing substantial or interesting to me.
Where this began
ChatGPT has demonstrated very impressive capabilities, so one day I wanted to test some random abilities of it. And at that point my inner annoying geography-nerd challenged it do a duel and quizzed its geographical knowledge. From this I found that it could:
- Accurately recall coordinates of a given city.
- Calculate the great-circle distance between any two cities.
- Calculate bearings between two cities
- Fairly accurately fetch cities nearby a coordinate
- Figure out the country a coordinate was in
- Couldn’t calculate the distance or bearings between two coordinates.
I thought abilities 2 and 6 being both true was interesting - it seems it could perform the underlying task of calculating distance but couldn’t on arbitrary numerical data, I thought this was interesting grounds to investigate. Especially if ChatGPT has actually grokked how to calculate great-circle distances. I decided to begin by looking at the simplest task, recalling coordinates. This first post looks at what I investigated, is dedicated to that, any following posts will focus on investigating the other tasks.
This capability is more boring to look into, but I had a reason to look into this: when I saw ChatGPT do any of these tasks I thought I observed variable amounts of error, and it seemed to correlate for cities I considered obscure. Perhaps investigating the simplest task will also give a measurement of what cities ChatGPT considers obscure, and perhaps a proxy measurement for geographical or linguistic biases in GPT3’s training set.
An example of how ChatGPT performed on coordinate recall from manual input:
| City | Actual coordinates | Predicted |
|---|---|---|
| Kolkata, India | 22.5726° N, 88.3639° E. | 22.5726, 88.3639 |
| Kaduna, Nigeria | 10.5264° N, 7.4388° E. | 10.5319° N, 7.4294° E |
| Shiyan, China | 32.6292° N, 110.7980° E. | 22.8389° N, 120.4646° E |
My Approach
I used this city database from Kaggle, giving over 28,000 cities, each with their coordinates, population and other data. I filtered the cities down by population to include only those of populations of over 200,000, leaving us with 2,800 cities. Then I created a function that queries the OpenAI chat API using the GPT-3.5-turbo model; and without change to any model parameters. (This means it is using the default temperature of 1, and there is a random component to the output). The prompt I used, is given below:
System: “You are a helpful assistant, give the coordinates of a city, when provided. Answer tersely, to 6 decimal places, in the format X°(N/S), Y°(E/W).”
User:”{city}”
This prompt was designed to:
- Minimise number of tokens in the response,
- Get the coordinates in a mostly universal format rather than the possibility of -50.5°, 12.5° or 50.5°W, 12.5°N.
- Coax ChatGPT to give a precise answer as possible
Sometime it will respond, asking for a disambiguation of which city, and I handle this by using the same prompt above, but also give the country. One might see issues with this, but I’ll discuss that here[1]. An example of ChatGPT’s response is given below.
Sorry, could you please provide more information on which Concord you are referring to? There are multiple cities/towns/villages with this name in different parts of the world.”
Once I had it working I got it running on my database, I did some rather unsystematic sampling[2] that I don’t have the patience to completely iron out, though it works well enough. This sample contains around 800 cities, from all continents and is slightly skewed towards very populous nations (e.g. China). I only did a subset of the 2,800 cities as the API requests were slow, and I was only making one request at a time.
Calculating error
Once I obtained the coordinates given by ChatGPT, I calculated the error. For the error, I decided to use the great-circle distance between the given coordinates and the one from the Kaggle database, using kilometres as the units. Since this is using the haversine formula, I call this value haversine throughout the rest of this post.
Findings
- There’s no strong correlation between population and the haversine, small and large cities can both have near-zero haversines. There is potentially some non-linear patterns going on, but that represents more effort I don’t have. Large cities don’t get confused at all (and there are still some ambiguity errors in the data) so they will tend to have a lower haversine. Larger cities have more sprawl and a less defined city centre, so various answers might exist for the coordinate of a city.
- North America has across the board a larger haversine, I think this might be linked to sprawl.
- For sheer majority of cases the variance in answers given by ChatGPT is essentially 0, so it behaves quite deterministically (with temperature 1) so this suggests that ChatGPT has no sense of uncertainty when it answers.
The first graph I plotted was haversine distance against the population of the city.
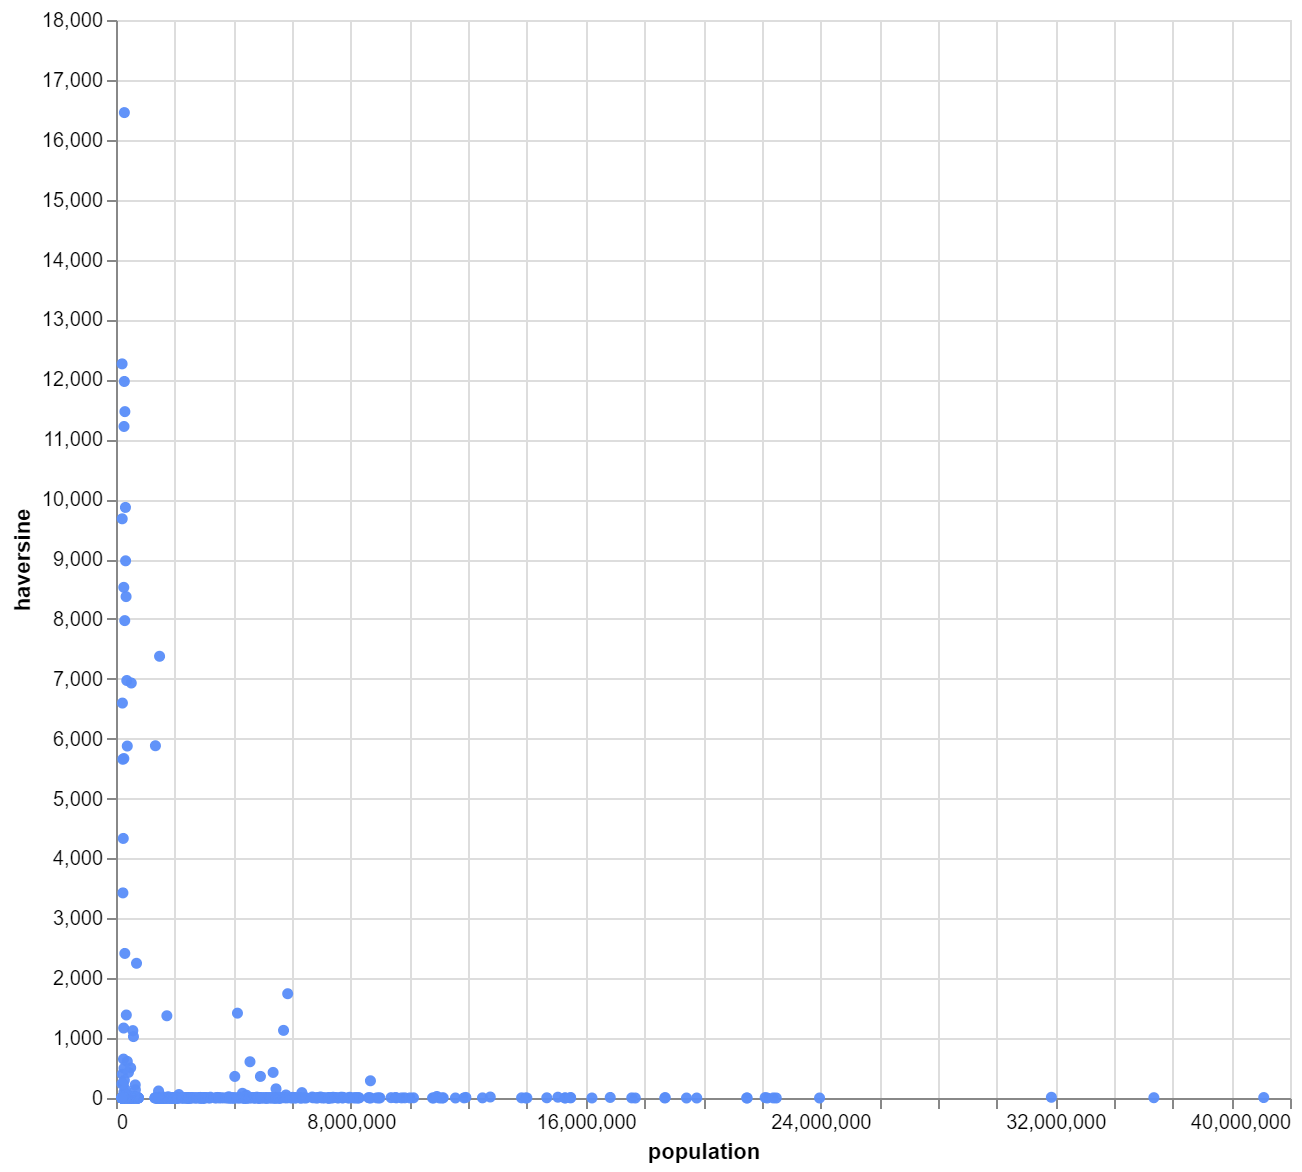
This revealed there many anomalies. The greatest distance possible, which is half the circumference of the earth, is around 20,000km and we have several answers on this scale. I examined every data point with a haversine distance of over 1,000km and found nearly all where from ambiguous cases or some strange oddity, more detail here[5]. I removed these anomalies from the data and then got something that looks like this. Within the 1000km to 100km there are other anomalies that I ignored.
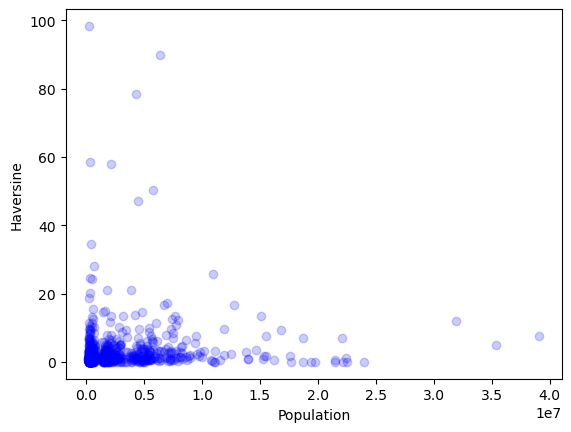
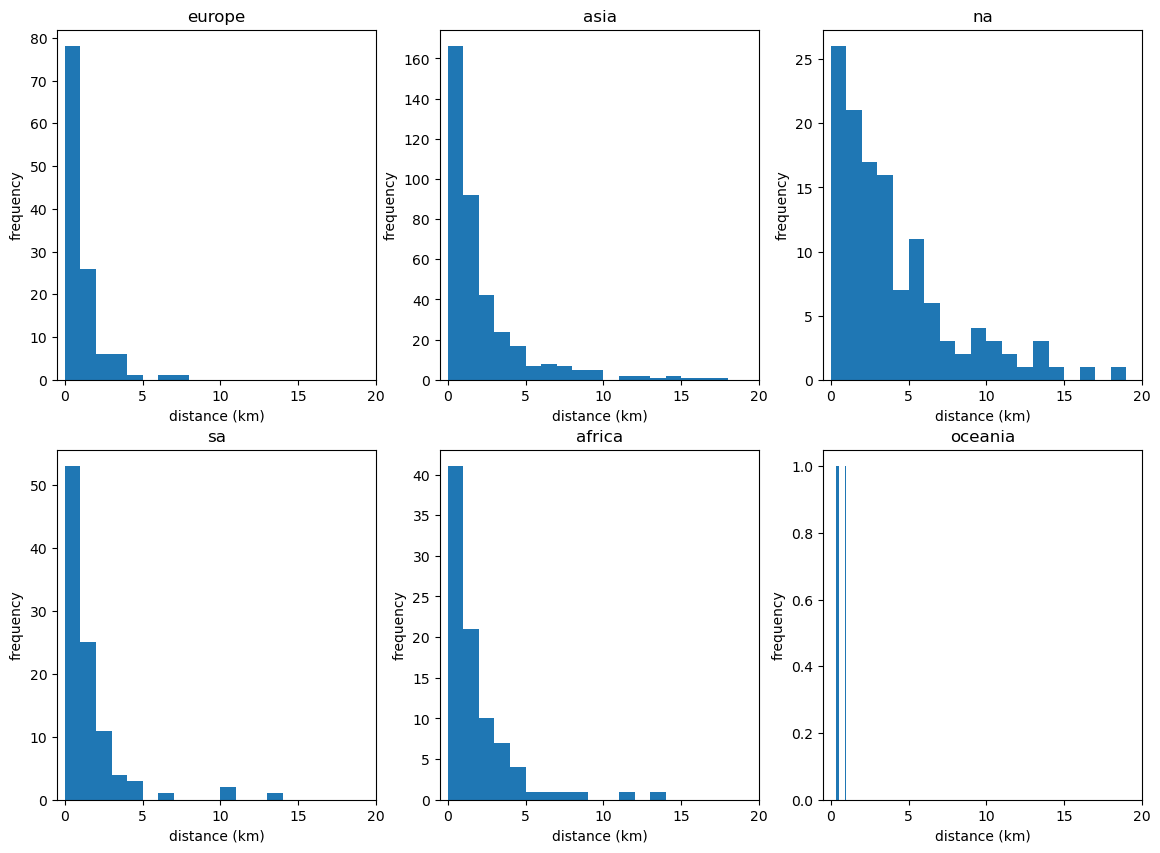
Focusing on datapoints of <10km haversine.
First we see that a city doesn’t require a large population to have a low haversine error, there are many smaller cities (200k) with near exact answers. Counter-intuitive to my theory, the megacities Delhi, Jakarta, Tokyo have a haversine between 3km and 10km. I guess this is because of sprawl, and ambiguous city centres. For example if you google the coordinates of Tokyo you can find multiple different answers from many sources, so it is possible this discord is the explanation for why it is so high for Tokyo.
Examining the data in detail most prominent cities have near zero haversines, but not all those with zero haversines seem very prominent. At this point I would suggest that this haversine error, doesn’t discernibly depend on population (it is possible it is a factor for cities less than 200k that I’ve ignored).
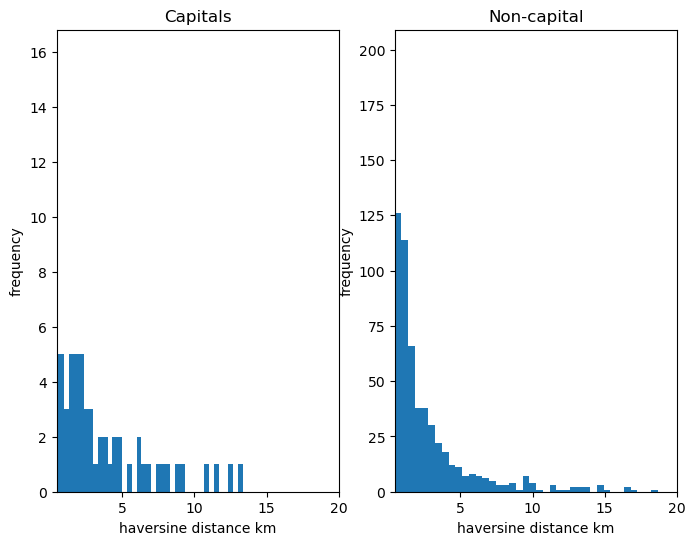
Capitals
Grouping the data by capital cities and non-capitals, we can calculate means and medians. Interesting the mean for capitals is lowest but highest median. I think this is because there are far more anomalies in non-capital data, but this also means non-capitals get much more accurate answers at the small scale (<2km) which we can probably just attribute to disagreement between sources.
| All cities | Capitals | Non-Capitals | |
|---|---|---|---|
| Mean | 10.63 | 3.64 | 11.30 |
| Median | 1.21 | 1.81 | 1.18 |
| Count | 857 | 75 | 782 |
Continent
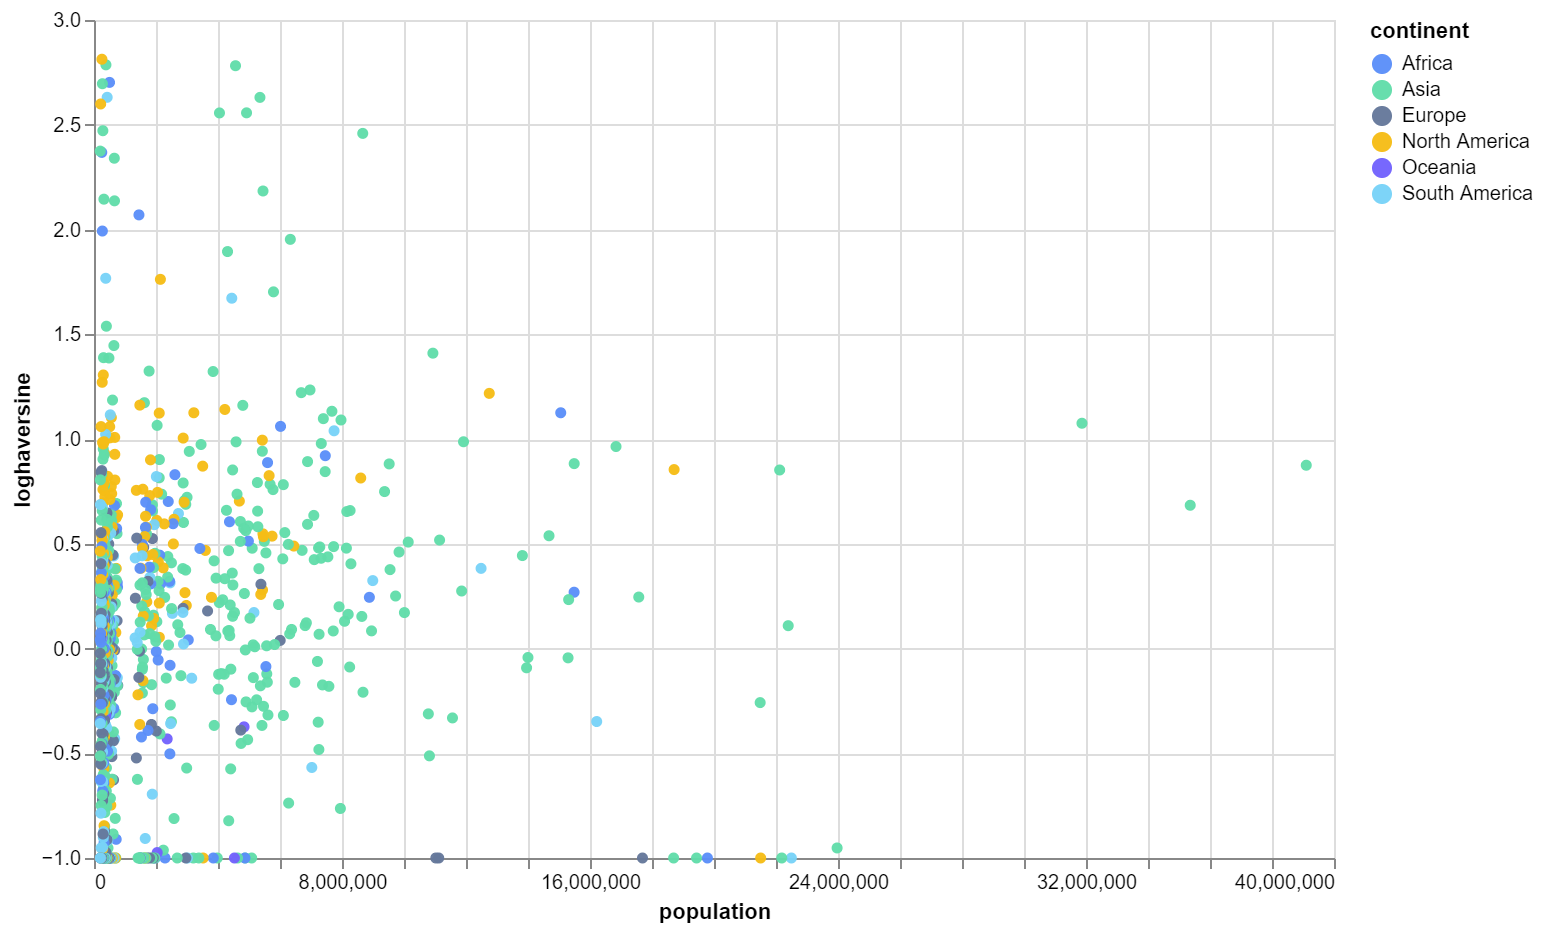
Grouping by city’s continent, I produced the following graph and table of average haversine. It’s quite surprising most accurate continents overall are, especially North America being the highest. Though since this data is so complex it’s hard to even comment why any the order is like that.
| Measure | Africa | Asia | Europe | North America | South America | Oceania |
|---|---|---|---|---|---|---|
| haversine mean | 12.0121 | 13.7024 | 1.0218 | 12.6534 | 0.5034 | 6.6091 |
| haversine median | 1.1160 | 1.2927 | 0.7122 | 3.0183 | 0.9000 | 0.4226 |
| count | 93 | 406 | 119 | 129 | 103 | 7 |
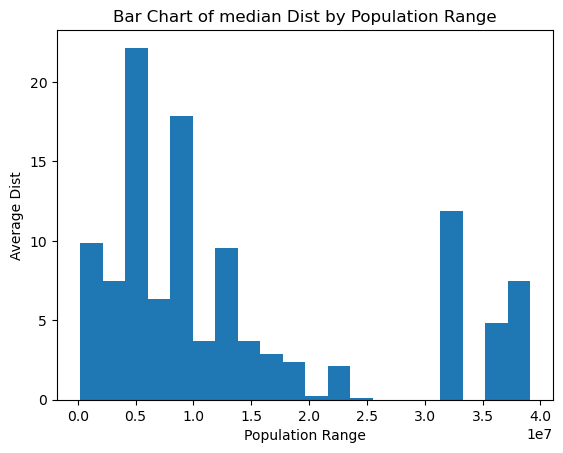
Now here’s the average haversine distance, plotted against population. This shows nothing new, but reinforces that the simple negative correlation between population and haversine distance is not there.
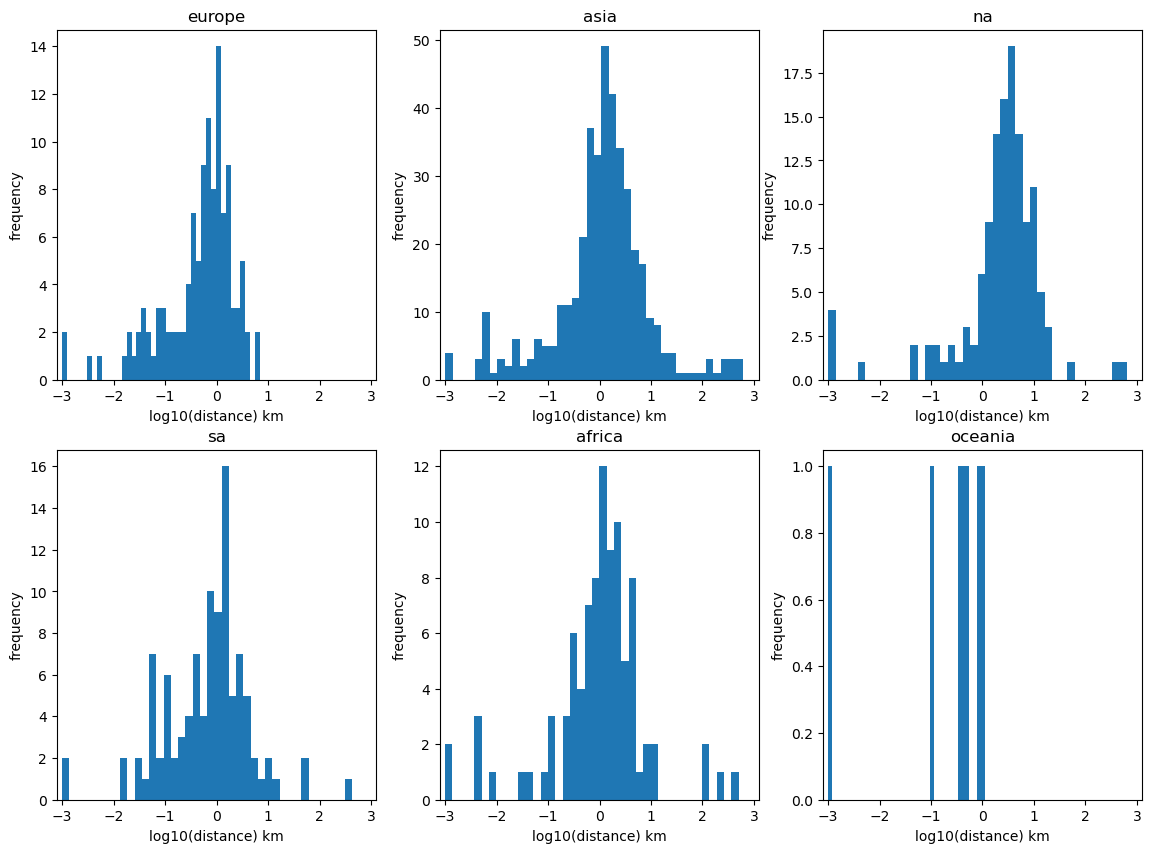
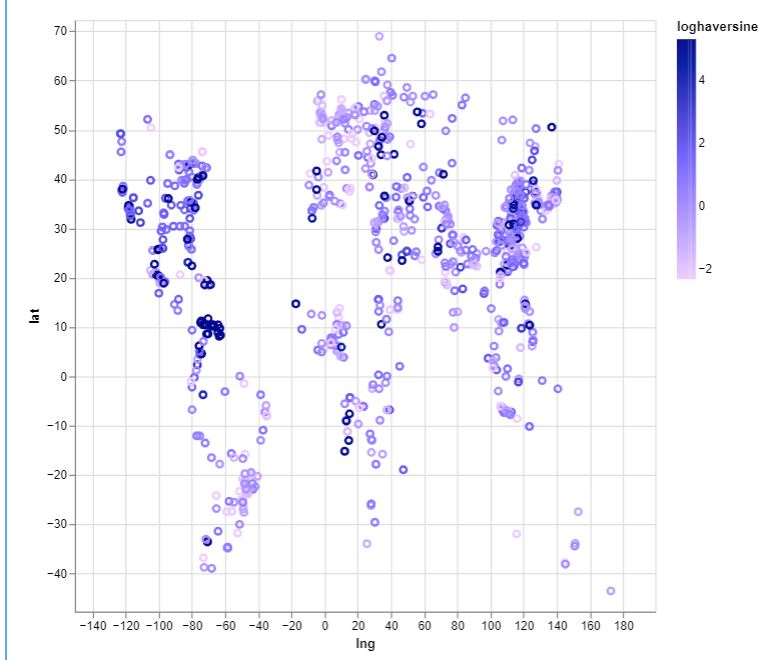
If we look for geographical trends and plot on map it looks like this.
And if we separate every data point into 5 different groups \(G_{-1}\), \(G_0\), … to \(G_3\), each \(G_i\) containing data points with a loghaversine, that is in the interval \([i, i+1)\)
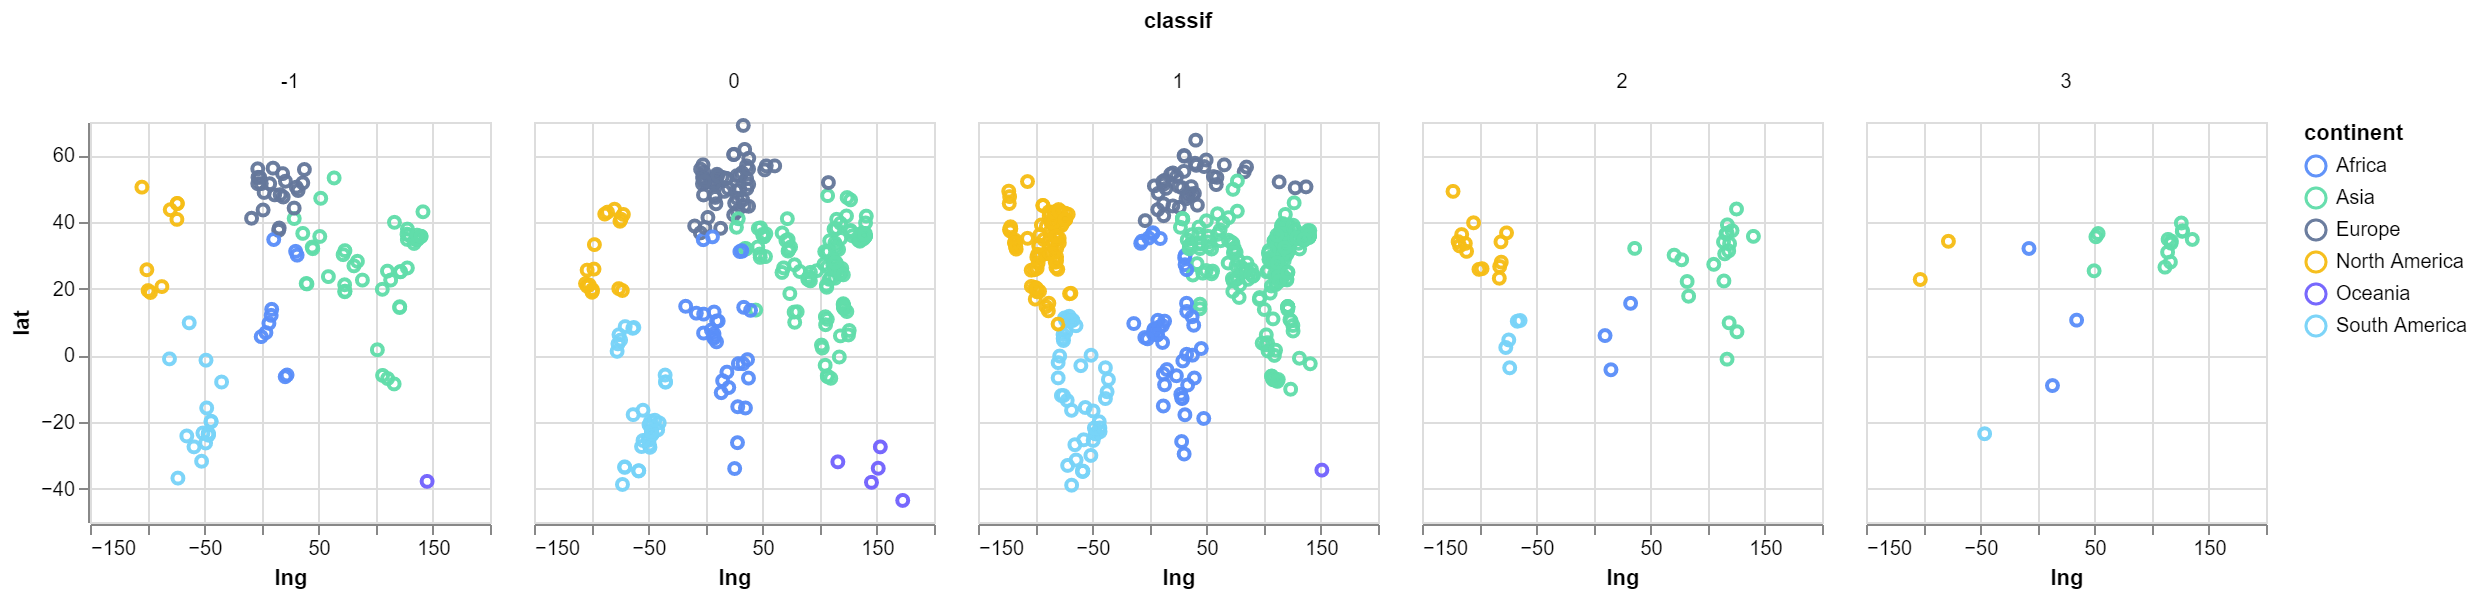
This does reveal that China more than any other nation has the most amount of cities with greatest error, this could be a consequence of their being more cities in the database to sample and therefore more likely to get more errors.
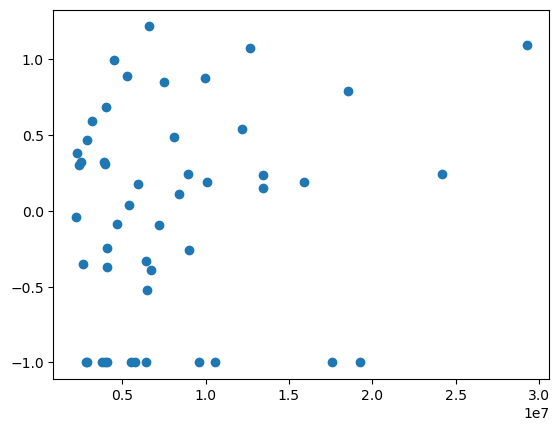
Tourism
Another correlation I speculated was that loghaversine might correlate with tourism. Using this Wikipedia resource, and mixing various tourist numbers for about 100 cities, plotting tourist numbers in (2018 or 2016 if they are missing) against loghaversine I get this. There is no visible correlation.
Variance
With some quick dirty data collection I also collected a sample of 20 cities from Europe, North America, South America, Africa and Asia, sampled them 10 times and measured the variance in the lat-long coordinates given by ChatGPT. Besides some ambiguous cases or gigantic errors, there was very little difference between North American cities and the other continents when looking at the variance. ChatGPT is very consistent with its answers.
Conclusions
I think that there’s some probability that something interesting can be found from ChatGPT3, however my methodology is too flawed to find any subtle trends that cannot be attributed to small inaccuracies and biases introduced at several steps. Furthermore, this no longer represents a simple hobby task, as some data-cleaning will be needed.
The main barriers, besides time and Ugh-fields, are:
- The Worldcities database’s reliability (with coordinate inaccuracies cities, and cities with little proof of their existence).
- Demonstrating regional bias would require more individual study and expands breadth of work and makes it harder to do look anything globally.
- Potential flaws in my method, including the sampling and by city disambiguation for chatGPT.
Footnotes
[1] I didn’t want it to be given the country of the city, because that feels like your priming the model and not properly testing it.
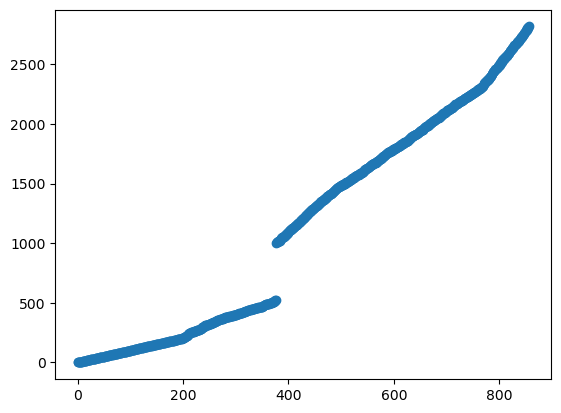
[2] I only sample by doing a city once, I didn’t want to have to do it multiple times- though that would be more robust against random mistakes and then could measure the std. I did sampling by starting doing the top 376 populous cities (that didn’t fail during the request). This took me to the 523rd sample, meaning 147 somehow failed. Then since I had so much China sampled I blacklisted it, then starting from the 1000th most populous samples, got 484 samples by incrementing by either 4 or 5. So yeah kind of scuffed when you want a representative sample. A graph below sort of shows how I sampled.
[3] Out of the 31, 28 turned out to be ambiguous city names, mostly from ones that I assume were American (North and south) colonial settlements. Examples like York, London, Córdoba. Amusing examples were ChatGPT confusing La Florida, Chile for the entire state of Florida and Babylon, New York for the ancient city of Babylon. There were a few oddities with guessing Ganda, Angola as a location in the Atlantic sea and Bắc Ninh, Vietnam in the Indian Ocean. And the final one being a city called Nangandao, that ChatGPT thought was real and so did the database, but I can’t find a location for it.
[4] It seems plausible when you notice how well ChatGPT is at recalling information on obscure content that happens to be on Wikipedia. Observations like asking it about Babylon gives the coordinates of the ancient city rather than the town in New York. It can also easily recall well geolocational data of small English towns using the OS grid reference (A grid reference system in Britain). I’ve also seen it memorises postal codes and populations fairly accurately.
Addendum
API usage
Overall I spent a total of $0.21 on API calls, from 1646 total text completion calls. Since I obtained 857 records, that means half of all calls resulted in a timeout or required a disambiguation. Using the pricing of $0.002/1k tokens means I must have used 105,000 tokens total and about 60 tokens a request.
What I learnt
- Familiarity with OpenAI API. I am more aware now that spending more than 5 minutes to reduce API costs is insane when dealing with such few API calls. So in the future I will be less hesitant to experiment and less afraid to fail.
- Python has no inbuilt library to add a timeout for a function for windows, and it only exists for Linux. Which to me is completely insane.
- Pygwalker is kind of a cool library for exploring data, though it there seems like some ridiculous features that should be in by default. Like you can’t have a scatter plot with constant opacity for each data point without creating a column in your data frame with just a constant value to put into the graph’s opacity attribute.
Suggested follow-work
- How does it compare to other models? (GPT2, GPT4, Claude, etc.)
- Can we fabricate city names, and get ChatGPT to answer? My few tries seem to be no, but maybe a good query could coax an answer out. I think China might be the best bet as ChatGPT gave answers for cities I could find little evidence for.
- China, Japan and maybe several other countries have their city names not represented in their native language, this could bias the data in some way. Perhaps if this is repeated this issue should be properly considered.
- Perhaps a map could be generated from a LLM’s understand of the world.